⚠️ EDUCATIONAL CONTENT ONLY
This guide teaches you how to study and learn from market patterns. It is NOT financial advice. All trading decisions, risk management, and position sizing are your responsibility. Always consult a qualified financial advisor before investing.
1 Pick Your Educational Focus (Rainbow Lanes)
CrashDash uses color-coded severity levels to help you understand different types of crash patterns. Think of these as "risk lanes" for learning purposes:
🟡 YELLOW LANE – Crash Zone (80%+ Drawdown)
Learning Focus: Early accumulation phase patterns
- RSI < 45, cycle position < 30%
- Study for early warning system patterns
- Watch for evolution into higher severity tiers
🟢 GREEN LANE – Deep Crash (85%+ Drawdown)
Learning Focus: Balanced educational examples with technical confirmation
- RSI < 40, cycle position < 25%
- Good starting point for beginners learning crash patterns
- Study these to understand moderate-risk setups
🟠 ORANGE LANE – Extreme Crash (90%+ Drawdown)
Learning Focus: Severe crash reversal patterns
- RSI < 35, cycle position < 20%
- Higher volatility examples—study these to understand significant upside potential vs. risk
- Educational examples of high-probability setups
🔴 RED LANE – Ultra Crash (95%+ Drawdown)
Learning Focus: Catastrophic crash patterns
- RSI < 30, cycle position < 15%
- Study these for maximum risk/reward educational scenarios
- Only for learning about extreme volatility situations
🟣 PURPLE – Enhanced Combo Signals
Learning Focus: Crash + Accumulation patterns combined
- Shows base severity color + purple "ENHANCED" indicator
- AI detected both extreme oversold conditions AND institutional accumulation
- Study these to understand the strongest educational reversal candidates
💡 Learning Tip: You can focus your studies by choosing a "lane":
- "I'm studying Yellow/Green patterns" (more conservative learning)
- "I'll research Orange/Red when I understand extreme volatility better"
2 Time Commitment – Minutes, Not Hours
CrashDash is designed to save you research time. Here's a typical learning routine:
Daily Educational Routine (20-30 minutes):
- Open CrashDash – Once per day (morning or evening)
- Filter by your focus lane – Look at signals in your chosen color category
- Shortlist 1-5 tickers – Pick the most interesting educational examples
- Research each one:
- Read RNS news & announcements
- Review basic fundamentals
- Study recent price action patterns
- Check sector context
- Decide: Add to watchlist for further study / Pass / Archive for comparison
💡 Key Point: Total time is often under 30 minutes. No need to manually scan 600 charts. CrashDash filters the noise so you can focus on learning from the best educational examples.
3 Learning Guidelines for Beginners
If you're new to studying crash patterns, follow these educational principles:
📖 Study Before Action
- Don't rush into trades – Use CrashDash to build your watchlist and study patterns first
- Paper trade first – Track signals on paper to learn how they behave before risking real capital
- Start small – If you do trade, use position sizes that won't cause emotional decisions
🧪 Learn From Variety
- Don't focus on just one signal – Study multiple examples to understand pattern diversity
- Compare outcomes – Track which patterns worked vs. didn't work to refine your understanding
- Understand failure – Not all crash signals recover—learn to identify warning signs
🎯 Educational Expectations
- Some patterns move quickly – Recovery might happen in days
- Some take time – Months or even years to fully develop
- Some fail entirely – This is normal and part of market reality
⚠️ Critical Learning Point:
Accept that some educational examples will never play out as expected—and that's completely normal. The goal is to study patterns and probabilities, not find certainties.
4 Educational Expectations & Reality
What CrashDash Does:
- ✅ Helps you find educational crash & recovery patterns faster
- ✅ Provides structured scoring and filtering for research efficiency
- ✅ Combines multiple data sources (price, volume, news, fundamentals) in one view
- ✅ Shows you historical context so you can learn from past examples
What CrashDash Does NOT Do:
- ❌ Guarantee profits or outcomes
- ❌ Tell you when to buy or sell (that's your decision)
- ❌ Replace your own research and due diligence
- ❌ Predict the future with certainty
💡 Think of CrashDash as:
A research assistant that does the boring scanning work, so you can spend your time on the interesting part—learning about market behavior and making informed decisions.
Timeline Reality Check:
CrashDash focuses on crash & recovery educational stories, which means:
- Days: Some patterns show quick reversals (study momentum shifts)
- Weeks to Months: Most quality setups take time to develop (study patience)
- Years: Some deep value plays are multi-year stories (study conviction)
- Never: Some simply fail and teach you what to avoid next time
The aim: Find better educational stories earlier, not guarantee an ending.
5 📊 Key Metrics to Study
AI Technical Score (0-21 points)
Multi-factor scoring system that helps you learn about:
- RSI extremes (how oversold?)
- Volume spikes (capitulation signals?)
- Momentum shifts (trend exhaustion?)
- Cycle positioning (where in the range?)
- Price compression patterns (coiling for move?)
Higher scores = Stronger technical reversal setup (for educational study)
Drawdown Percentage
How far the price has fallen from all-time high. Study this to understand:
- Severity of the crash
- Potential upside if recovery occurs
- Risk level (deeper drawdowns = more volatility)
Current P&L
If you had entered at signal date, what would your educational return be today?
- Helps you track signal effectiveness over time
- Understand which patterns tend to work vs. fail
- Learn from both winners and losers
Best Historical Rally
Peak gain achieved from similar past signals on this ticker. Study this to:
- Understand upside potential
- See if ticker has history of violent recoveries
- Compare current setup to historical patterns
📊 Real-World Example: WSBN.L (Wishbone Gold)
📈 WSBN.L Chart Example
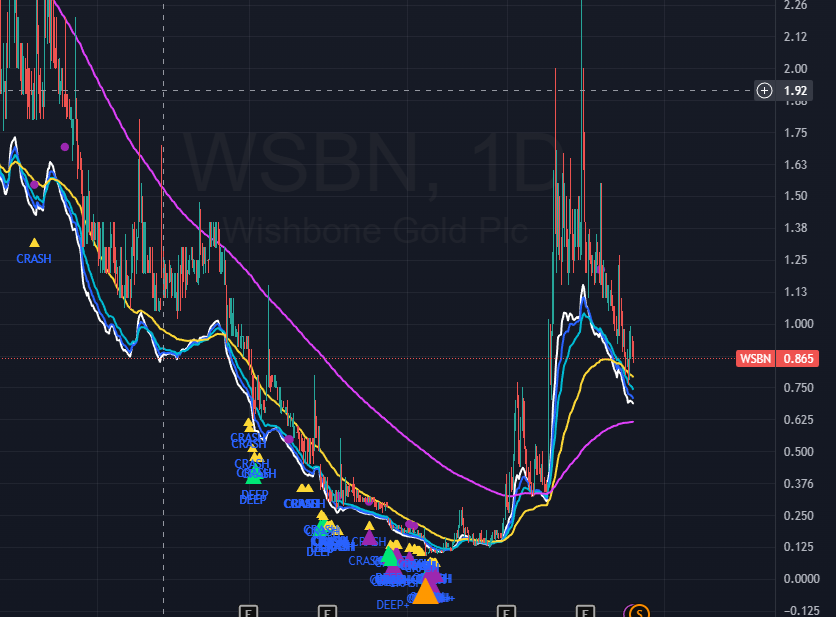
Textbook crash-to-recovery pattern: £0.09 → £2.00 (+2,122%)
📉 The Setup (Educational Case Study)
Wishbone Gold (WSBN.L) demonstrates an ideal crash signal pattern that CrashDash is designed to identify:
📅 Timeline of Events:
- July 2024: Early crash signals detected (yellow zones - 80%+ crash)
- Mid-March 2025: 🟠 ORANGE signal highlighted at absolute bottom (~£0.09)
- Purple accumulation zones: Multiple instances of price consolidation with volume building
- August 2025: Rally to £2.00+ = 2,122% gain from bottom
🎯 What Made This Setup "Ideal"?
- Catastrophic Crash – Price dropped from highs to near-zero (massive drawdown)
- Multiple Signal Levels – Yellow → Orange progression showed increasing severity
- Accumulation Evidence – Purple spots indicated smart money quietly building positions
- Bottom Consolidation – Price stabilized and "went flat" instead of continuing to fall
- Volume Pattern Change – Capitulation volume followed by quiet accumulation
⚠️ Critical Reality Check:
Not all signals guarantee huge runs like this.
- WSBN is an exceptional example, not the norm
- Many crash signals recover modestly (20-50%)
- Some take years to play out
- Some never recover at all
However, the principle remains true:
"Money is always made at the bottom of markets."
💡 What CrashDash Helps You Identify
This example shows what the engine is looking for:
- ✅ Extreme oversold conditions (orange/red severity levels)
- ✅ Consolidation after panic (price stops falling, goes sideways)
- ✅ Accumulation patterns (purple enhanced signals = smart money building)
- ✅ Early positioning (signals triggered months before the rally)
💡 Learning Takeaway:
CrashDash flagged WSBN at £0.09 in March 2025 with an 🟠 ORANGE signal. The rally to £2.00 took 5 months.
Most people would never look at a chart like this—it's too scary, too boring, too "dead." That's exactly when the opportunity exists.
CrashDash helps you study these setups systematically, so you don't have to manually scan 600+ tickers looking for them.
🎓 Study Questions for This Example:
- Why did the orange signal appear in March vs. earlier crash zones?
- What role did the purple accumulation patterns play?
- How long would you have had to hold to see the full move?
- What risk management would have been appropriate at £0.09?
- Would you have had the patience to wait 5 months?
Remember: This is ONE example used for educational purposes. Your job is to study many setups, understand the patterns, and develop your own judgment about which ones are worth pursuing. CrashDash gives you the shortlist—you provide the research and conviction.